
Session 7 — Data Solves Problems
Duration: 60 min · Format: live online
What you'll learn: by the end, you can use data to decide something fairly, turn that decision into a simple solution, and sketch an app idea that shows the answer.
Soft skill focus — Problem-solving
Today you'll also grow Problem-solving. Turning a messy argument ("what snack?") into a fair answer is problem-solving — and the data is your tool, not the whole job.
Try this: when you design your data helper, don't stop at the chart — decide "what's my rule if two choices tie?" so you solve the awkward case, not just the easy one.
Think about: What real problem could you solve with data this week, and how?
What you'll need
- Paper and a pencil for your app sketch.
- Optional: a device to open Scratch to build a sprite that says the winning answer.
Hook
Your class wants one snack for a party, but everyone's arguing. How could you decide fairly, without fighting?
Have a guess. You already learned the tool last session — collect data! Today data stops being just pretty pictures and starts solving problems.
Teach — Data helps you decide
Instead of guessing or arguing, you collect data and let it point to the answer. Look at this diagram:
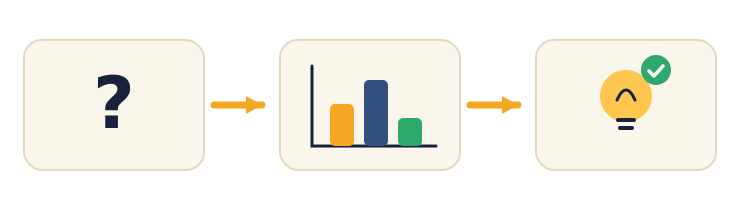
- Question — "Which snack for the party?"
- Data — survey the class, make a chart.
- Decision — pick the winner. Fair and clear.
Using data to decide is called making an evidence-based decision — scientists, doctors, and game designers all do it.
⚠ Watch out for the shortcut: it's tempting to skip straight to a decision from a guess. The decision has to come from the data you collected, not from what you personally hope wins.
Why is deciding with a survey fairer than the loudest person just choosing? (Everyone's vote counts and the result is based on evidence, not volume.)
Teach — From decision to solution
Once you know the answer, you can build a simple solution — and it doesn't need code. A solution can be:
- an app idea (a screen that shows the answer),
- a plan or a poster,
- a small Scratch project.
For example: an app called "Snack Picker" that shows the class's winning snack with a big happy picture.
Try it (optional): open Scratch and make a sprite say the winning answer when you click it.
Name one everyday problem where an app that shows an answer would help you.
Activity — Design a data helper
Design your own data helper.
- Pick a real problem at home or school (what to watch, where to sit, which book to read).
- Write the question and the data you'd collect to answer it.
- Sketch a simple app screen on paper: a title, the chart, and the answer in big letters.
Check that your answer clearly comes from the data you planned to collect, and that the screen has a title.
Want to build it? If you finish early, open Scratch and make a sprite say the winning answer when clicked.
Check yourself
Try to answer these, then check yourself after the arrow.
- What's a fair way to settle an argument about choices? → Collect data (a survey), chart it, and pick the winner — an evidence-based decision.
- Does a "solution" always need code? → No — it can be an app idea, a plan, a poster, or a small Scratch project.
- Name one job that uses data to decide. → Lots! Doctors, scientists, coaches, game designers, shop owners…
Wrap-up
- Finish this sentence: "Data helped me decide…"
- Try this at home — Decide with your family: find a real decision at home this week (movie night? dinner?). Collect a little data from your family, then decide together using the data. Bring the story to Session 8 — the big Unit 2 project.
Tips & extra challenges
- Watch out: it's easy to think "a solution means a finished computer program." A solution is any way to help — an idea, a plan, or a poster counts.
- Want more? Try this: organise before you analyse — put the data in a clean table in Google Sheets (one row per person; messy data → wrong answers). Then do a quick EDA: ask three questions of the data (most common? average? any surprise?) using
=MAX,=AVERAGE,=COUNTIF. For a tiny code challenge in Google Colab:
votes = [5, 7, 3]
print("Total:", sum(votes))
print("Winner has:", max(votes), "votes")
That's analysing data with Python. Mini-challenge: extend the sketch into a real decision helper — add a line that also prints the runner-up (the second-highest count) and then write, in plain English, the rule your helper follows to pick a winner (e.g. "pick the choice with the most votes; if two tie, ask one more person"). Naming the tie-breaker rule is the hard, valuable part — it's what turns a chart into a fair decision.
Vocabulary
| Term | Meaning |
|---|---|
| Decision | Choosing what to do |
| Evidence | Data that supports a choice |
| Solution | A way to fix a problem |
| App | A helper program on a screen |
| Sketch | A quick drawing of an idea |
Resources
- Scratch — build a simple interactive helper.
- Google Sheets — collect and chart your decision data.
- Code.org — App Lab — peek at how apps are made (made for ages 13+, so explore it with a grown-up).
- Google Colab — try the tiny Python challenge (extension).
Practice set
Practise on your own — these build from easy to hard on using data to decide and building a simple solution, and the answer comes after the arrow.
- Fair or not? The class is choosing a movie. Sam just shouts "we're watching mine!" Is that fair, and what's a fairer way? → Not fair — one loud voice decides. Fairer: survey the class and pick the most-voted movie.
- Question → Data → Decision. Fill the middle step: Question: "Which park game?" → Data: ??? → Decision: pick the winner. → Data: survey the group and count/chart the votes.
- Spot the shortcut. Lily hopes tag wins, so she writes "tag" as the decision before asking anyone. What did she skip? → She skipped collecting the data — the decision must come from the votes, not her wish.
- Design the screen. Sketch (in words) the three things a "Snack Picker" app screen should show. → A title, the chart of votes, and the winning answer in big letters.
- Spreadsheet task. In Google Sheets you have snack choices in A2:A4 and counts in B2:B4. Which formula finds the biggest count, and which counts how many people picked "chips" if their answers are listed in D2:D20? →
=MAX(B2:B4)for the biggest;=COUNTIF(D2:D20,"chips")to count the chips answers. - Break the tie (hard). Two snacks tie at 6 votes each. Give two fair ways to settle it without arguing. → For example: ask a few more people to break the tie, or run a second vote between just those two.
Going deeper (optional)
Optional — for a strong challenge. A decision can weigh more than one fact, so the "best" choice isn't always the one with the most votes. Take the party-snack example but add a second column: alongside Votes, add Cost (cheap / medium / pricey). Now the winner by votes might be too expensive, so you have to decide which fact matters more and say why. Make a tiny table in Google Sheets with both columns and talk through a rule out loud — "pick the most-voted snack we can actually afford." This is your first taste of a trade-off, and it mirrors how real decisions (and real apps) balance several bits of data instead of blindly following the biggest number. Keep it to a discussion plus a two-column sheet — no new tools.
Common mistakes & fixes
- Mistake: jumping to a decision from a guess or a personal hope instead of the data. → Fix: make the decision point back to the collected votes — evidence first, opinion second.
- Mistake: believing a "solution" must be a finished, coded program. → Fix: an app idea, a plan, a poster, or a paper sketch all count as solutions.
- Mistake: sketching an app screen that shows a chart but never states the answer. → Fix: put the decision in big letters on the screen — the whole point is to show the answer clearly.
- Mistake: collecting messy data (different spellings, blanks) then trusting the count. → Fix: tidy the data into a clean table first — one row per person — because messy data gives wrong answers.
- Mistake: ignoring ties or awkward results because they "don't fit" the hoped-for winner. → Fix: plan a fair tie-breaker (ask more people, or a second vote) and report the real result honestly.
What's next
Session 8 — Tell a Data Story: the big Unit 2 project — you ask, collect, chart, and tell the story of what you found.